We ran a denial analysis for a small specialty practice and reported that about $98 of denials in the period looked worth appealing. Billing looked well-run. Not much to recover.
That number was wrong by roughly 55×. The real figure, same practice, same month, was $5,413.
The interesting part is not the mistake. It is why the mistake was invisible — because the same blind spot is built into the denial reporting most practices rely on.
The short answer
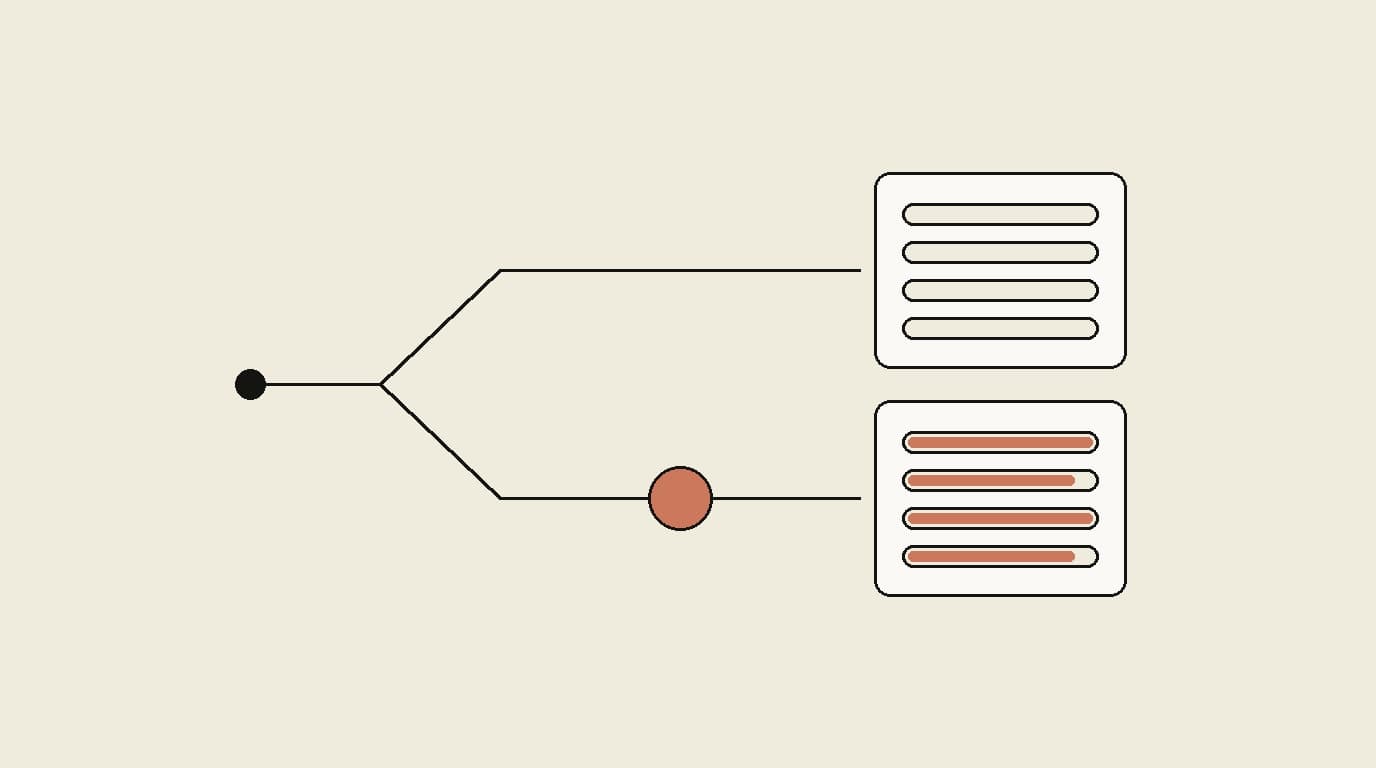
A fully denied claim line pays $0.00. It posts no payment record. So a denial report built from posted payments has nothing to attach a reason code to, and the line simply does not appear.
Our first pass read reason codes off posted payments. That method sees every adjustment on a claim the payer paid something on — contractual write-downs, patient responsibility, partial reductions. It is completely blind to the claim the payer refused outright.
Those outright refusals are where the recoverable money is.
What we did, and what we got wrong
The practice runs as our live testing environment, which is the only reason we can publish this at all: it is our own data, and we got to make the mistake on ourselves before making it on a customer.
First method (wrong): read the practice's charge ledger through the practice-management API, pull the adjustment reason code attached to each payment. This was already better than the canned report, which collapses everything into a single "contractual" line. It surfaced 2,890 coded adjustment lines over 90 days, and it correctly identified $107.7K in contractual write-offs and $10.7K in patient responsibility.
It found $98 in appealable denials in the month.
The flaw: it can only itemize adjustments on charges where a payment posted. A claim denied in full pays nothing, posts nothing, and carries no reason code in that view. Every total denial was structurally invisible.
Second method (correct): read the practice's actual electronic remittances — 245 remittance reports covering one month, 769 service lines, 306 claims, 72 checks, 12 carriers. The remittance describes the adjudication, not the payment, so a $0.00 line still carries its reason code.
| One month, same practice | Payment-derived | From the remittances |
|---|---|---|
| Appealable denials | $98 | $5,413 |
| Fully denied lines | 0 visible | 139 lines · $7,659 billed |
| Reason codes recovered | CARC only | CARC + RARC |
We were measuring the claims that got paid and calling it a denial analysis.
Why this matters beyond our error
The method we used first is not exotic. Reading reason codes off posted payments is roughly what a standard practice-management denial report does. If your report shows denials as overwhelmingly "contractual," that may be accurate — or it may be the same blind spot, showing you the adjustments it can see and silently omitting the refusals it cannot.
One check tells you which: ask whether your denial report includes lines the payer paid $0.00 on. If it cannot answer, or the count is zero, you are looking at a payment report wearing a denial report's title.
What the corrected data showed
Three findings, and none of them is "your billing team is bad."
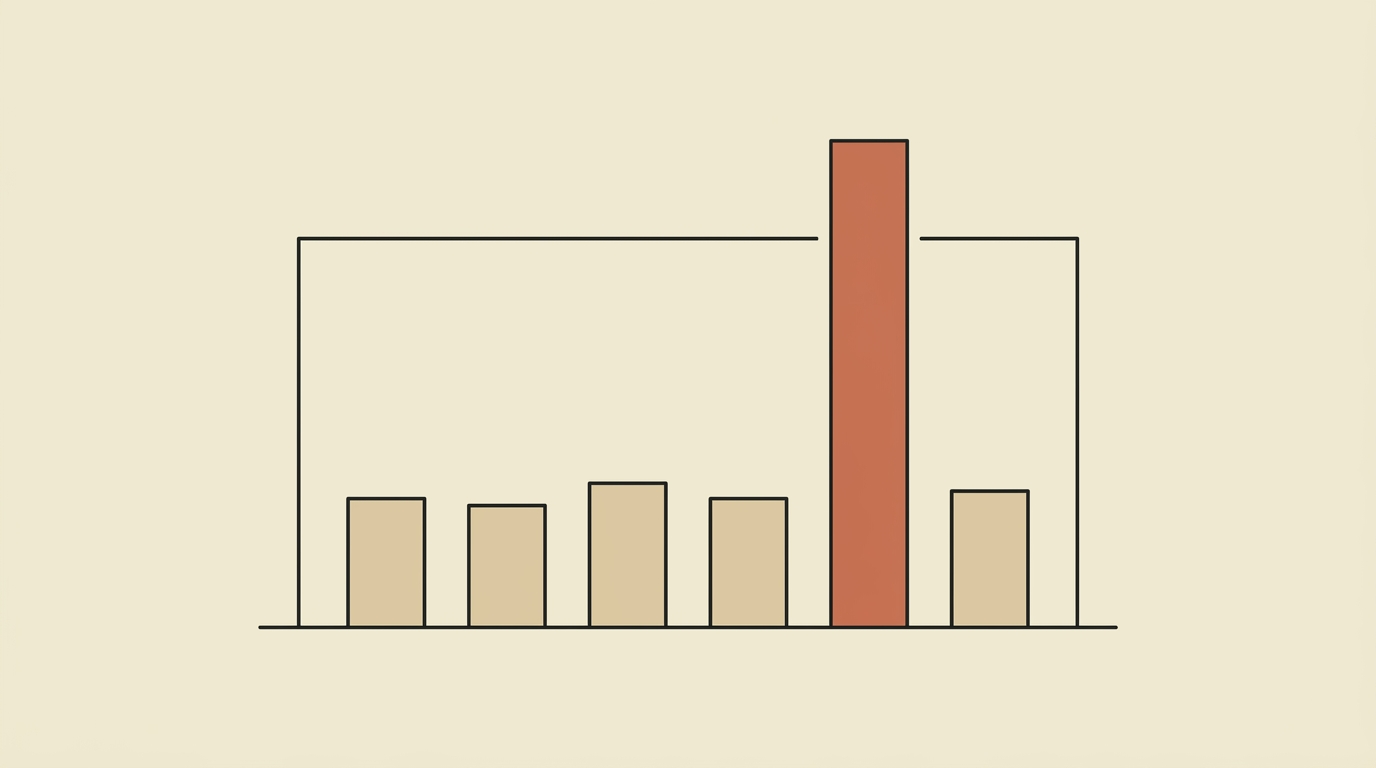
It was concentrated, not scattered. One payer accounted for more than half the appealable total. This was not diffuse leakage across hundreds of small errors; it was a small number of repeating failures with a specific payer.
It repeated, which means it was preventable. The largest pattern hit 8 separate service dates in a single month. Another hit 4. A denial that recurs on a schedule is not bad luck — it is a rule nobody has written down yet.
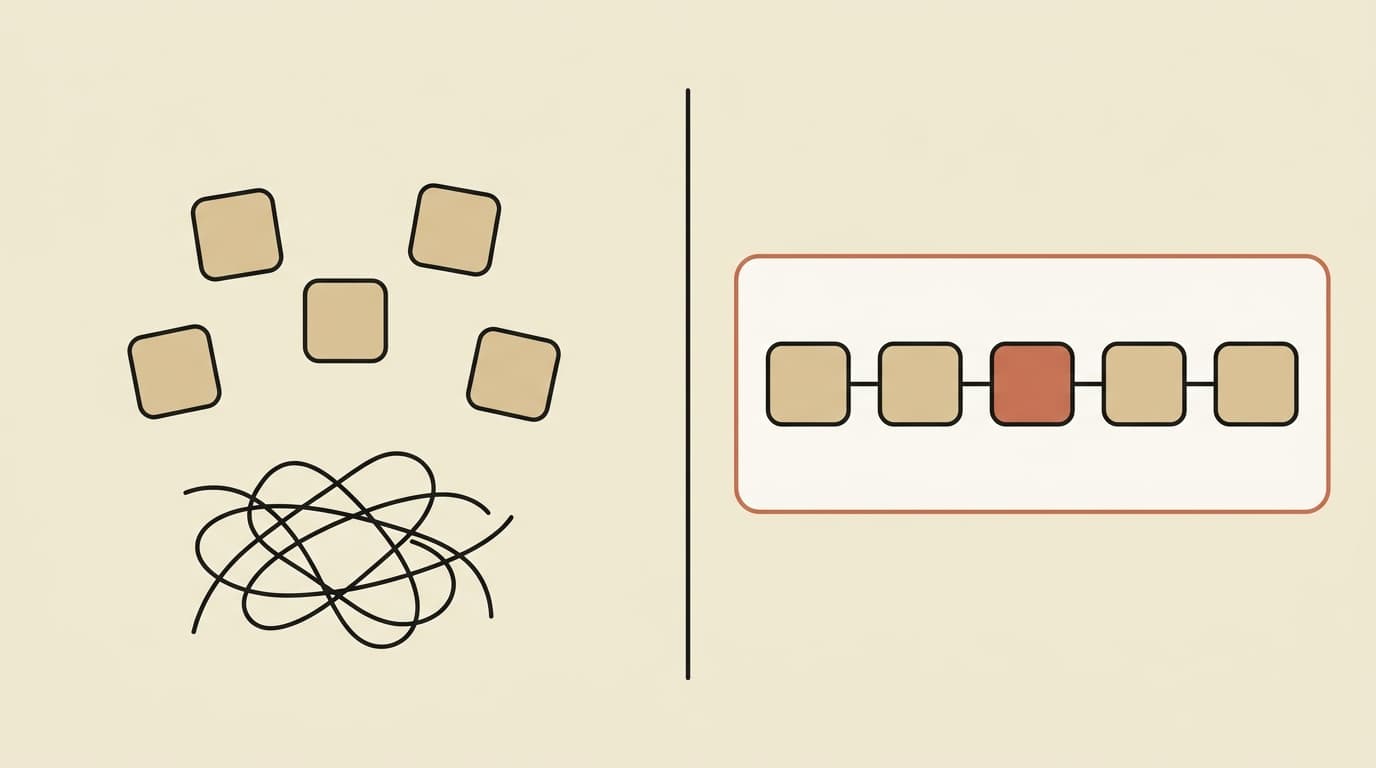
The remark code held the fix. CARC CO-251 on its own says "missing information," which tells you nothing actionable. Paired with RARC N479 it says missing primary payer EOB — a coordination-of-benefits step that got skipped. That pairing exists only in the remittance. A report showing CARC alone gives you the complaint without the instruction.
Two rules alone — a modifier conflict on annual wellness visit codes, and the missing primary-payer EOB — accounted for roughly $820 in a single month, and both are checkable before a claim goes out.
The uncomfortable part: this practice was already doing well
This is not a cautionary tale about neglect. It is a practice where automation had already cut eligibility and prior-authorization-related denials by 65%. That result stands — and understanding why it happened explains exactly why this analysis still found so much left over.
The 65% came from running better eligibility checks before the visit. Verify coverage properly ahead of time and you stop the denials that are caused by bad coverage information: inactive plans, wrong member IDs, missed secondaries, authorizations that were never obtained. That is a real fix, and it is why the improvement showed up in those categories and only those.
But a modifier conflict on two codes billed the same day is not a coverage problem. Neither is a missing primary-payer EOB, or a duplicate submission, or a place-of-service mismatch. Fixing the front door does nothing about the denials that happen after a correctly verified patient is correctly seen. The eligibility agent was never going to catch those, and it didn't.
So both figures are true at once: eligibility-driven denials fell sharply, and the categories nobody was watching kept costing about $5,400 a month.
That is the honest reading, and it is more useful than either number alone. "Well-run billing" was a conclusion produced by the measurement, not a fact about the practice.
The industry context
Our finding is one practice, one month. What makes it worth generalizing is how it fits the published data:
- Health Affairs, analyzing 270 million Medicare Advantage claim submissions, found an initial denial rate of 17%, that 57% of denials were ultimately overturned — and, critically, that only 60% of denied claims were ever resubmitted (Health Affairs, 2025)
- AHA reports 15.7% of Medicare Advantage and 13.9% of commercial claims are initially denied, with 54.3% ultimately overturned (AHA)
- KFF found HealthCare.gov insurers denied 19% of in-network claims in 2024, and that fewer than 1% of denied claims were appealed (KFF)
- MGMA's benchmark puts first-submission denial rates around 8% for single-specialty practices, with under 5% best-in-class (MGMA)
Put together: most denials that get appealed are overturned, and most denials never get appealed. The loss is rarely a lost argument. It is an argument nobody made — often because nobody saw the denial in the first place.
What a real denial report needs
If you are evaluating a denial product, or building your own report, these are the requirements that separate one that works from one that flatters:
| Requirement | Why |
|---|---|
| Includes $0.00-paid lines | The single most important one. Without it you are reading a payment report |
| CARC and RARC | The remark code usually contains the instruction |
| Grouped by pattern | Payer × code × CPT, so repeats become visible |
| Deduplicated | The same remittance can arrive twice and inflate a count |
| Unknown codes routed to review | Never default an unrecognized code to "contractual" |
| Separates non-appealable | Contractual write-offs and patient responsibility are not denials |
| Aging on unadjudicated claims | Claims that never got a response quietly expire into timely-filing write-offs |
That last one matters more than it sounds. Alongside the denials, the same analysis found claims sitting unpaid with no reason code at all — the payer had simply not responded. Those do not appear in any denial report, because nothing was denied yet. They just age until the filing window closes.
How we counted, so you can disagree
The method matters more than our number, since your number will be different:
- Source: the practice's own electronic remittances, 245 reports over one month, retrieved through the practice-management API with no manual download
- Denial definition: a service line the payer paid $0.00 on with no allowed amount — precisely the population the first method could not see
- Deduplicated on check, claim ID, service date, CPT, charged amount, reason code, and modifiers, because the same remittance can arrive more than once
- Classification by exact CARC: contractual write-offs and sequestration to non-appealable; patient responsibility codes to patient; coding, coverage, authorization and duplicate refusals to appealable. Unknown codes route to manual review, never silently to contractual
- Validated against a manual pull: for the one week the practice had downloaded remittances by hand, the API returned every check they had — plus six they had missed
Limits, stated plainly: one practice, one month, one specialty, one payer mix. The dollar figure is not a benchmark and we are not presenting it as one. The finding we do think generalizes is the structural one — a payment-derived report cannot see a $0.00 line — because that is arithmetic, not a sample.
Frequently Asked Questions
Why do denial reports miss denials?
Many denial reports are built from posted payments — they read the adjustment reason code attached to each payment record. That works for a claim the payer paid something on and reduced. It fails completely for a claim the payer denied outright, because a fully denied line pays $0.00, posts no payment record, and therefore carries no reason code for the report to read. The denials that cost you the most are the ones the report is structurally unable to see.
What is the difference between CARC and RARC codes?
CARC is the claim adjustment reason code, which states why an amount was not paid. RARC is the remittance advice remark code, which usually says what the payer wants you to do about it. CO-251 alone means missing information. CO-251 paired with RARC N479 means the primary payer's explanation of benefits was not attached, which is an instruction rather than a dispute. The remark code is where the fix usually lives, and it only appears in the remittance.
Where do I find my practice's real denial data?
In the electronic remittance advice, the 835 file the payer sends with each check. That is the only record that carries the reason code for a fully denied line, because it describes the adjudication rather than the payment. Some practice management systems expose remittances through an API, some only through a downloadable report, and retention windows vary. Anything older than your system's retention window generally has to come from your clearinghouse.
How much are denials actually costing a small practice?
It varies enormously by payer mix and specialty, and any vendor quoting one number across all practices is quoting a best case. In the single month we examined at one small specialty practice, 139 fully denied lines represented $7,659 in billed charges, of which we classified $5,413 as carrying a fixable reason. What matters more than the figure is that it was concentrated: one payer accounted for more than half, and the largest patterns repeated on multiple service dates within the month.
Is it better to appeal denials or prevent them?
Prevent them, where the denial is caused by a rule you can check before submission. A prevented denial costs nothing to fix and never enters anyone's work queue, while an appealed denial costs staff time even when it succeeds. In the month we analyzed, three of the four largest patterns were pre-submission rule failures rather than genuine adjudication disputes, and they recurred on a schedule. Appeals still matter for what prevention cannot catch.
How many denied claims are never resubmitted?
A large share. Health Affairs, analyzing 270 million Medicare Advantage claim submissions, found that 60% of denied claims were resubmitted — meaning 40% never were. Of those resubmitted, two-thirds were overturned. Industry sources put the never-resubmitted figure across payers even higher. The money is not usually lost to failed appeals; it is lost to appeals nobody filed.
What should a denial report actually show?
Every denied line including the ones that paid zero, the CARC and RARC together, the payer, the service date, and the dollar amount, grouped so repeating patterns are visible. It should also separate genuinely non-appealable adjustments such as contractual write-offs from refusals with a fixable reason, and it should say which bucket unknown codes went into. A report that collapses everything into one contractual line is not wrong so much as incomplete in the specific place that costs money.
What to do this week
You do not need a vendor to check this. Ask your billing lead two questions:
- "Does our denial report include lines the payer paid zero on?"
- "Can you show me the remark codes, not just the reason codes?"
If either answer is no, your denial picture has a hole in it of unknown size. Pull one month of remittances by hand and count the $0.00 lines. That afternoon will tell you whether you have a $98 problem or a $5,413 one.
We are building this into a denial recovery agent that reads remittances nightly, groups the repeats, and drafts the corrected claim or appeal. But the diagnosis above is yours to run regardless of who you buy from — and if your report already passes both questions, you are ahead of where we were.